
|
Annualized Enrollment Fast Facts
This dashboard report displays the unduplicated Annualized Enrollment broken out by college for the current and prior year. The user selects the desired Academic Year.
|

|
College Fast Facts
This dashboard report displays Fall Enrollment by college and information about the ethnicity, gender, and age of the enrolled students. In addition, the report presents information about a college’s unduplicated Annualized Enrollment and the number of awards for each college, broken down by academic cluster. The user selects the desired college and Fall Semester Year.
|

|
Congressional District Fast Facts
This dashboard report displays Fall Enrollment for the Congressional Districts and information about the ethnicity, gender, and age of the enrolled students as a whole. In addition, the report presents information about the unduplicated Annualized Enrollment and the number of awards, broken down by district. The user selects the desired district number (1 – 7) and the Fall Semester Year.
|
|
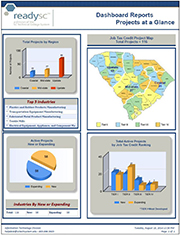
Projects at a Glance
This dashboard report provides information from readysc programs. The summary tracks new or expanding companies in South Carolina.
|
|
|
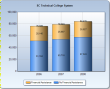
SC Technical College System Fast Facts
This dashboard report displays Fall Enrollment for the College System and information about the ethnicity, gender, and age of the enrolled students as a whole. In addition, the report presents information about the unduplicated Annualized Enrollment and the number of awards, broken down by college. The user selects the desired Fall Semester Year.
|

|
Semester Enrollment Fast Facts
This dashboard report displays the unduplicated Semester Enrollment broken out by college for the current and prior year. The user selects the desired Semester and Semester Year.
|
|
|
Internet Browser Problems, Fixes,
and Security Settings
|
|
Common Internet
Browser Problems and Fixes
|

|
Problem: Some websites might not display correctly in Windows Internet Explorer
8 and above. For example, portions of a webpage or report might be missing, information
in a table might be in the wrong location, or colors and text might be incorrect.
Some webpages might not display at all.
Fix: View the website using the compatibility
view.
1. Open Internet Explorer. Enter the web address of the application
in the address bar, for example https://www.sctechsystem.edu/DashBoard_Reporting/default.aspx#
to open the website. For Internet Explorer 11 compatibility add sctechsystem.edu under Tools(Alt-X)->Compatibility View Settings. Add the site, the site should appear in the Websites you've added to Compatibility View dialog box.
2. Click the Compatibility View button
 on the Address bar or in the Tools dropdown.
|
|
|
Problem: Another potential web browser issue is freezing or crashing. We recommend
you use Windows Internet Explorer version 5 or greater as your
browser. If the browser experiences an error, or it encounters a certain web object
that it cannot run properly, it mighty freeze up.
Fix: Close out of all open internet windows, and restart the program using Windows
Internet Explorer.
|
|
Problem: This website uses popup windows for reporting. To allow the website to
render some reports you must “Turn Off Pop-up Blocker” in
the Tools section of Internet Explorer.
Fix: Turn off pop-up blocker.
1. Click the "Tools" dropdown on the Windows Explorer Toolbar.
2. Click “Turn Off Pop-up Blocker”
|
|
|
Problem: Trouble paginating or printing a .pdf from Windows Internet Explore.
Fix: Set the Display PDF in browser checkbox in Adobe Reader.
1. Open up Adobe Reader.
2. Go to Edit tab across the top.
3. On the Edit menu, chose preferences.
4. ON the preference menu, chose internet
5. Uncheck the “display PDF in browser box and close out.
|
|
|
|
Windows Internet
Explorer Security Settings for Most SCTCS Internet Applications
|
|
|
Problem: This Website allows the user to download reports in an Excel format. When
the file download box fails to appear you must enable File Download
in the Downloads section under the Security tab.
Fix: Enable File Download
1. On the Tools menu, click Internet Options, and then click the Security tab.
2. Click the Custom level.
3. Click Enable for File Download in the Download section. Click the OK button.
Click the OK button one more time.
4. Return to the webpage, and then click the Refresh button
 to allow the download file dialog
box to run. to allow the download file dialog
box to run.
5. If the item still does not run, close out of the browser entirely, and then restart
the program.
|
|
|
Problem: This Website uses .Net Framework. To allow website work properly you must
enable Enable .NET Framework Setup under the Security tab.
Fix: Enable Enable .NET Framework setup
1. On the Tools menu, click Internet Options, and then click the Security under
the Security tab.
2. Click the Custom level.
3. Click Enable for Enable .NET Framework setup. Click the OK button. Click the
OK button one more time.
4. Return to the webpage, and then click the Refresh button
to run the new framework.
5. If the item still does not run, close out of the browser entirely, and then restart
the program.
|
|
|
Problem: This Website uses scripting to enhance your browsing experience. To allow
website to enter and validate data you must enable Active Scripting in
the Scripting section under the Security tab.
Fix: Enable Active Scripting
1. On the Tools menu, click Internet Options, and then click the Security under
the Security tab.
2. Click the Custom level.
3. Click Enable for Active Scripting in the Scripting section. Click the OK button.
Click the OK button one more time.
4. Return to the webpage, and then click the Refresh button
to run scripts.
5. If the item still does not run, close out of the browser entirely, and then restart
the program.
|
|
|

|
Age Categories
The first table displays the actual percentage distribution for eight age groups: 17 & <, 18-19, 20-21, 22-24, 25-29, 30-39, 40-49, and 50 and over for the respective year. The second table displays the opening fall headcount enrollment for the same age groups consistent with the distribution in the first table.
|

|
Average and Median Age
Average and median age are displayed in a bar chart for the fall term and college selected.
|
|
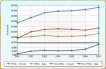
Ethnicity and Gender (Multiple Years)
Opening fall headcount enrollment is displayed for non-white female, non-white male, white female, and white male populations. Students who did not report ethnicity or gender are excluded from the display. The chart displays opening fall headcount change over time while the table displays the accompanying data.
|
|
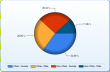
Ethnicity Gender Single Year
Opening fall headcount enrollment is displayed for non-white female, non-white male, white female, and white male populations for a selected opening fall term. Students who did not report ethnicity or gender are excluded from the display. The chart displays opening fall headcount percentage distribution by ethnicity and gender while the table displays the accompanying data.
|

|
Fall Enrollment by Cluster
Enrollment data are provided for each of the nine cluster areas: Arts & Science, Agriculture, Occupational, Business, Computer, Engineering Technology, Health Science, Industrial, and Public Service. In addition, students who were enrolled in Career Development or Undetermined Objective are displayed as ‘Non-degree Seeking.’ A URL to identify programs within clusters is provided through SharePoint under the ‘Cluster’ tab. Programs
|

|
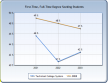
Fall Enrollment Growth
Opening fall headcount enrollment change is displayed as a percentage of change from the base year to the current year as selected by the user. Changing the base year recalculates the percentage change through the current term. Accompanying the display is a table that includes opening fall headcount enrollment for the colleges selected as well as national opening fall headcount data for public two-year colleges. The national data is updated in July in the NCES Digest of Education Statistics, and reflects an approximate two year lag in reporting. National Data may be found at: http://nces.ed.gov/programs/digest/d11/tables/dt11_199.asp
|
|

|
Completion by Program
This report displays a Tech computed ‘Graduation Rate’ by program for each technical college and for the System, and allows the user to select cohort years, as well as selected student demographic categories to include registration status, financial assistance, enrollment status, ‘new to program’, program, and graduation category. The analysis is based on a System defined graduation rate to determine if the student received an award in subsequent terms of the cohort three year period. (Note: This is different from IPEDS GRS logic in that it ignores the 150% rule and incorporates awards received any time during the three year period.) Two user selections identify students who graduated from the original program and students who graduated from a different program. Once a student has been identified as having graduated from an original program, the indicator is set and requires no future analysis in that original program takes precedent over subsequent awards. ‘New to program’ represents students enrolled in the respective cohort and program who were not enrolled in that program in the previous fall or spring term. If not enrolled in the previous fall or spring term in that program, but enrolled in that program in the summer term prior to fall, student will be considered ‘new to program’. Certificate programs are unique to each college.
|

|
National, SREB, and System Graduation Rates
In this national reporting series (IPEDS GRS), data are collected on the number of students entering the institution as full-time, first-time, degree/certificate-seeking undergraduate students in a particular year (cohort), by race/ethnicity and gender; the number completing their program within 150 percent of normal time to completion; and the number that transfer to other institutions if transfer is part of the institution’s mission. This dashboard displays the graduation rate statistic. The reporting of national and regional data comes from Southern Regional Education Board (SREB), which uses its own national formula for reporting two-year colleges (thus the reported percentage differs slightly from NCES’ publications). SREB’s data reporting lags approximately one year behind the completed cohort term. For example, the 2007 – 2010 graduation rates should be available in September 2011. Source: SREB fact book and its web page on First Year Persistence, Progression, and Graduation Rates: http://www.sreb.org/fact-book-tables
|

|
Number Completers and Awards
The report displays the number of awards which include students who may have received more than one formal award between the following dates: July 1, 20XX and June 30, 20XX+1.
|
|
Regional & System Progression Rates
In this reporting series, the student progression rate includes completers, those still enrolled and transfers from the cohort within 150 percent of normal time. Members of the initial cohort who are deceased, totally and permanently disabled, left school to serve in the armed forces or the federal foreign aid service such as the Peace Corps, or who left school to serve on an official church mission are subtracted from the cohort before percentages are calculated. For example for the 2001 cohort (2001-2004), students who were full-time, first-time, degree seeking students in fall 2001 are included in the denominator. Students who completed programs within 150% of program length, students who transferred to other post-secondary institutions through summer 2004, and those still enrolled as of fall 2004 are included in the numerator.
|
|
SC Technical College System Report Delivery Application
|
Readme
|
This document includes important information about the student dashboard application
site for the SC Technical College System report delivery system.
|
Reporting versions
1. The reporting interface was coded using Visual Studios ASP.net 2010 and Telerik
v.2013.1.417.40.
2. The reports were created using sql server 2008 r2.
|
|
|
|
|
|
|
|
|

|
Developmental Education First-time Freshmen
This dashboard is a measure of the percentage of first-time freshman students (including non-degree-seeking students) taking one or more developmental education courses. The number and percentage of developmental education students is based on first-time freshmen students having taken one or more MAT, ENG, ESL, or RDG courses with a course number of less than 100. The percentage computation is calculated as [first-time freshmen having taken one or more developmental courses] / [total first-time freshmen]. Analysis is for Opening Fall headcount.
|

|
Licensure Pass Rates
This dashboard displays the percentage of students passing licensure exams. The college data are taken from the CHE Institutional Effectiveness Reports due in August of each year. The pass rate is based on exams taken between April 1st to March 31st. National data are included where available, but are based on the calendar year from January 1st to December 31st of the prior year. Example: A national report range selection of 2011-2012 would be equivalent to exams taken between; January 1, 2011 to December 31, 2011. A pass rate is considered “unknown” when the percent passed and the number tested are both zero (0). This may indicate there are no test takers for that year or the program has been discontinued.
|
|
Student Financial Assistance Disbursement Summary Report
This report displays trend data on the number and award amounts for students receiving financial assistance. Data for this report are for the applicable year and semester, and are derived from the EDSS Disbursement File. The total award amount is based only on the college, applicable year and semester, and does not take into account student demographics.
|
|
|